 It has been several years since we presumed to write this opinion article and wondered the logic and reason of it all.
While the plite of women seems a noble enough cause to ponder, we now ask where did this all go so wrong to the point males now claim to be female to the ludicrous point of claiming the feminine ability of menstruation and child birth?
Did the powers what be simply throw in the towel? Have such scandals and exposures as Epstein Island scandal, Panama Papers, political hijinks, pay to play scandals contributed to visions of WWIII retaliation to wipe the slates clean?
Have the bastard progeny of kings proven far too arrogant to be allowed to continue with silly notions of individual freedom and rights to ownership of land?
Only the Future May Tell
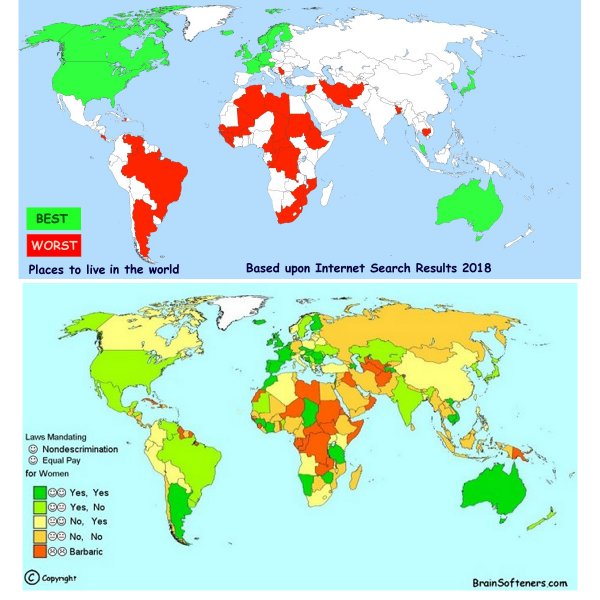
We studied the plight of people in countries across the globe in Shitheads and Shinola to determine demographic criteria of Best and Worst.
This interest began with wondering how a country, city or state qualifies for the “Best or Worst places to (live, vacation, work, succeed)” categories.
First phase of the research concluded the “best” places to live overall seem overwhelming with a majority of Caucasian ethnicity.
Not surprisingly, the “worst” places overall seem underwhelming with Caucasian ethnicity.
Which led to another question…and then another, and another:
- Who is the intended audience for Best or Worst?
- Who writes this stuff?
- What audience cares most about overwhelming or underwhelming populations of Caucazoid ethnicity?
- What criteria other than race/ethnicity could be at play?
- Wealth
- Health
- Oil and Natural Resources
- Government
- Faith
- Happiness
- Resistance
- Politics
- Globalization
- Labor
- Development (aka colonization)
- …
Suspicions confirmed..but is the schism over ethnicity/race alone? Could it be more?
While Visions of Classism Danced in our Heads
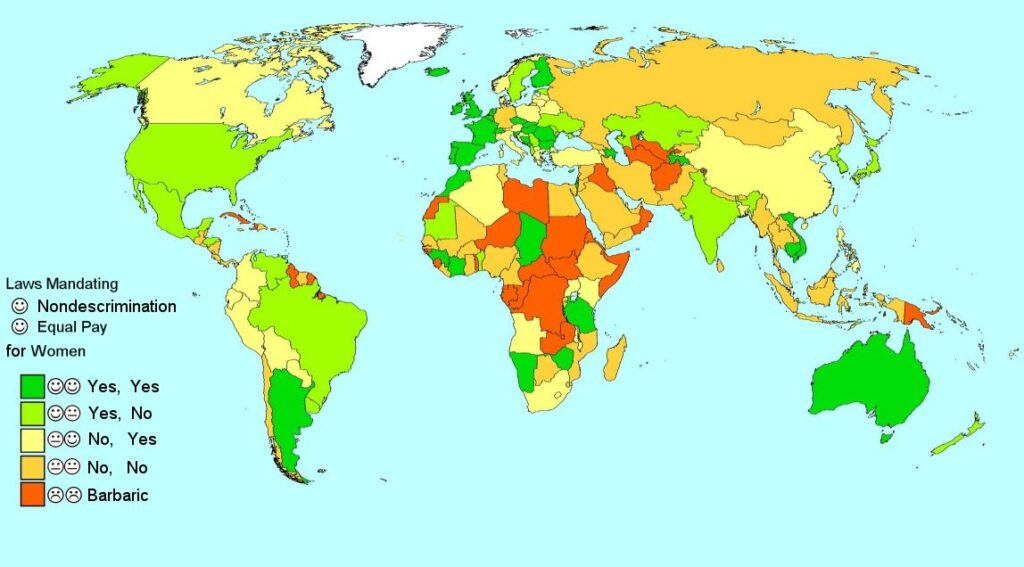
Thought it might be interesting to make a new visual map to display gender conditions by country, but with only two simple criteria.
Does the Country Have Laws that Mandate:
- Non-discrimination for hiring women – Yes or No
- Equal pay between males and females – Yes or No
Sounds simple enough. Straight forward, cuts through the minutiae that conceals, obfuscates and confuses upon interpretation.
Does your country mandate these laws?
- Yes
- No
One might assume a country with both laws mandated has the strongest gender equality protection.
Pick and Choose.
Some countries mandate both gender equality and equal pay laws. Some countries mandate only one or the other.
Here’s where things get subjective. How to rank countries that provide only one protection but not the other.
Which mandate provides the strongest gender equality protection?
- Non-discrimination for hiring women?
- Equal pay between genders?
Non-discrimination gender laws encompass a range of human right’s Discrimination laws.
- Age
- Caste
- Disability
- Employment
- Language
- Name
- Nationality
- Race or ethnicity
- Region
- Religious beliefs
- Sex, sex characteristics, gender, and gender identity
- Sexual orientation
- Drug use
- Othering
- Reverse discrimination
- Redlining
Equal pay pairs with development of job training and negotiation skills.
Scoring System:
- Both laws mandating non-discrimination and equal pay
- One law mandating one or the other but not both
- No laws no protections
Best or Worst Protections – Mandated Gender Discrimination & Equal Pay Laws
Here come the binary bits necessary to determine the color codes for the countries on the world map.
| Yes = 1 | No = 0 |
| Strong | Tepid | Weenie | Stubborn | Barbaric |
| Dark Green | Light Green | Yellow | Orange | Red |
| Y, Y
1, 1 |
Y, N
1, 0 |
N, Y
0, 1 |
N, N
0, 0 |
?, ?
0 |
? = Countries which generate a lot of complaints, provide no data, are clueless, didn’t understand the question, barbaric, undergoing civil strife and have otherwise unknown Human Rights History.
Questions:
- Does one mandate hold more or less importance over the other?
- Why do some countries opt for “Yes” to one mandate but “No” to another.
- Does it make a difference which law is mandated in a particular order.
- Does adopting one law and not the other make an effective difference, bring benefit or hardship to a country’s economy.
- What is the criteria for determining a rank to label a country as better or worst for women when?
- A country discriminates in hiring women but guarantee equal pay for women?
- A country mandate non-discrimination laws for hiring but not equal pay between genders
The result of looking at each country through the narrow focus of “Mandated Law” concerning gender equality produces a world map different from the usual Global Gender Gap (GGG) reports.
Click on map for large version:
 Blue gender map (above) original here: Travel advisors recommend countries and destinations for travel with such designations as:
Gender equity is largely determined by workforce participation of women and men. Per Investopedia, the official definition of workforce participation is:
“The participation rate is a measure of the active portion of an economy’s labor force. It refers to the number of people who are either employed or are actively looking for work.”
Global Gender Gap World Map
How this map compares with Best and Worst countries is among the next landslide of questions as yet to unfold.
| Country | Rank | Score | Non-discrimination hiring women |
Equal pay between genders |
| Afghanistan | 0 | 0 | ? | ? |
| Albania | 38 | 0.74 | Yes | No |
| Algeria | 127 | 0.63 | No | Yes |
| Angola | 123 | 0.64 | No | Yes |
| Argentina | 34 | 0.73 | Yes | Yes |
| Armenia | 97 | 0.68 | No | Yes |
| Australia | 35 | 0.73 | Yes | Yes |
| Austria | 57 | 0.71 | No | Yes |
| Azerbaijan | 98 | 0.68 | Yes | Yes |
| Bahamas | 27 | 0.74 | Yes | No |
| Bahrain | 126 | 0.63 | No | No |
| Bangladesh | 47 | 0.72 | No | Yes |
| Belarus | 26 | 0.74 | No | Yes |
| Belgium | 31 | 0.74 | Yes | Yes |
| Belize | 79 | 0.69 | No | No |
| Benin | 116 | 0.65 | Yes | No |
| Bhutan | 124 | 0.64 | No | No |
| Bolivia | 17 | 0.76 | No | Yes |
| Bosnia and Herzegovina | 66 | 0.7 | Yes | Yes |
| Botswana | 46 | 0.72 | No | No |
| Brazil | 90 | 0.68 | Yes | No |
| Brunei Darussalam | 102 | 0.67 | No | No |
| Bulgaria | 18 | 0.76 | Yes | Yes |
| Burkina Faso | 121 | 0.65 | No | No |
| Burundi | 22 | 0.76 | Yes | No |
| Cambodia | 99 | 0.68 | Yes | Yes |
| Cameroon | 87 | 0.69 | No | No |
| Canada | 16 | 0.77 | No | Yes |
| Cape Verde | 89 | 0.69 | No | No |
| Central African Republic | 0 | 0 | ? | ? |
| Chad | 141 | 0.58 | Yes | Yes |
| Chile | 63 | 0.71 | No | No |
| China | 100 | 0.67 | No | Yes |
| Colombia | 36 | 0.73 | No | Yes |
| Costa Rica | 41 | 0.73 | No | No |
| Côte d’Ivoire | 133 | 0.61 | Yes | Yes |
| Croatia | 54 | 0.71 | No | Yes |
| Barbados | 23 | 0.75 | No | No |
| Cuba | 25 | 0.75 | ? | ? |
| Cyprus | 92 | 0.68 | Yes | Yes |
| Czech Republic | 88 | 0.69 | Yes | Yes |
| Democratic Republic Congo | 0 | 0 | ? | ? |
| Denmark | 14 | 0.78 | No | Yes |
| Djibouti | 0 | 0 | ? | ? |
| Dominican Republic | 70 | 0.7 | No | No |
| Ecuador | 42 | 0.72 | No | Yes |
| Egypt | 134 | 0.61 | No | No |
| El Salvador | 62 | 0.71 | No | No |
| Equatorial Guinea | 0 | 0 | ? | ? |
| Eritrea | 0 | 0 | ? | ? |
| Estonia | 37 | 0.73 | Yes | No |
| Ethiopia | 115 | 0.66 | No | No |
| Fiji | 125 | 0.64 | No | Yes |
| Finland | 3 | 0.82 | Yes | Yes |
| France | 11 | 0.78 | Yes | Yes |
| French Guiana | 0 | 0 | ? | ? |
| Gabon | 0 | 0 | ? | ? |
| Gambia | 119 | 0.65 | No | No |
| Georgia | 94 | 0.68 | No | No |
| Germany | 12 | 0.78 | No | No |
| Ghana | 72 | 0.7 | No | No |
| Greece | 78 | 0.69 | No | Yes |
| Greenland | 0 | 0 | ? | ? |
| Guatemala | 110 | 0.67 | No | No |
| Guinea | 113 | 0.66 | Yes | Yes |
| Guinea Bissau | 0 | 0 | ? | ? |
| Guyana | 0 | 0 | ? | ? |
| Haiti | 0 | 0 | ? | ? |
| Honduras | 55 | 0.71 | Yes | No |
| Hungary | 103 | 0.67 | Yes | Yes |
| Iceland | 1 | 0.88 | Yes | Yes |
| India | 108 | 0.67 | Yes | No |
| Indonesia | 84 | 0.69 | No | No |
| Iran, Islamic Rep. | 140 | 0.58 | No | No |
| Iraq | 0 | 0 | ? | ? |
| Ireland | 8 | 0.79 | Yes | Yes |
| Israel | 44 | 0.72 | Yes | Yes |
| Italy | 82 | 0.69 | No | Yes |
| Jamaica | 51 | 0.72 | No | No |
| Japan | 114 | 0.66 | Yes | No |
| Jordan | 135 | 0.6 | No | No |
| Kazakhstan | 52 | 0.71 | Yes | No |
| Kenya | 76 | 0.69 | No | Yes |
| Korea, Rep. | 118 | 0.65 | Yes | No |
| Kuwait | 129 | 0.63 | No | No |
| Kyrgyz Republic | 85 | 0.69 | No | No |
| Lao PDR | 64 | 0.7 | No | No |
| Latvia | 20 | 0.76 | No | Yes |
| Lebanon | 137 | 0.6 | No | No |
| Lesotho | 73 | 0.7 | No | Yes |
| Liberia | 107 | 0.67 | No | No |
| Libya | 0 | 0 | ? | ? |
| Lithuania | 28 | 0.74 | No | Yes |
| Luxembourg | 59 | 0.71 | Yes | No |
| Macedonia, FYR | 67 | 0.7 | No | Yes |
| Madagascar | 80 | 0.69 | No | No |
| Malawi | 101 | 0.67 | No | Yes |
| Malaysia | 104 | 0.67 | No | No |
| Maldives | 106 | 0.67 | Yes | No |
| Mali | 139 | 0.58 | No | No |
| Malta | 93 | 0.68 | Yes | Yes |
| Mauritania | 132 | 0.61 | Yes | No |
| Mauritius | 112 | 0.66 | Yes | Yes |
| Mexico | 81 | 0.69 | Yes | No |
| Moldova | 30 | 0.74 | Yes | No |
| Mongolia | 53 | 0.71 | No | No |
| Montenegro | 77 | 0.69 | Yes | Yes |
| Morocco | 136 | 0.6 | Yes | Yes |
| Mozambique | 29 | 0.74 | No | No |
| Myanmar | 83 | 0.69 | No | No |
| Namibia | 13 | 0.78 | Yes | Yes |
| Nepal | 111 | 0.66 | No | No |
| Netherlands | 32 | 0.74 | Yes | Yes |
| New Zealand | 9 | 0.79 | Yes | No |
| Nicaragua | 6 | 0.81 | No | No |
| Niger | 0 | 0 | ? | ? |
| Nigeria | 122 | 0.64 | No | No |
| Norway | 2 | 0.83 | No | Yes |
| Oman | 0 | 0 | ? | ? |
| Pakistan | 143 | 0.55 | No | No |
| Panama | 43 | 0.72 | No | No |
| Papa New Guinea | 0 | 0 | ? | ? |
| Paraguay | 96 | 0.68 | No | Yes |
| Peru | 48 | 0.92 | No | Yes |
| Philippines | 10 | 0.79 | No | Yes |
| Poland | 39 | 0.73 | No | Yes |
| Portugal | 33 | 0.73 | Yes | Yes |
| Puerto Rico | 0 | 0 | ? | ? |
| Qatar | 130 | 0.63 | No | No |
| Republic of the Congo | 0 | 0 | ? | ? |
| Romania | 58 | 0.71 | Yes | Yes |
| Russian Federation | 71 | 0.7 | No | No |
| Rwanda | 4 | 0.82 | No | No |
| Saudi Arabia | 138 | 0.58 | No | No |
| Senegal | 91 | 0.68 | No | No |
| Serbia | 40 | 0.73 | Yes | No |
| Singapore | 65 | 0.7 | No | No |
| Slovak Republic | 74 | 0.69 | Yes | Yes |
| Slovenia | 7 | 0.81 | Yes | Yes |
| South Africa | 19 | 0.76 | No | Yes |
| South Sudan | 0 | 0 | ? | ? |
| Spain | 24 | 0.75 | Yes | Yes |
| Sri Lanka | 109 | 0.67 | No | No |
| Sudan | 0 | 0 | ? | ? |
| Suriname | 86 | 0.69 | No | No |
| Swaziland | 105 | 0.67 | No | No |
| Sweden | 5 | 0.82 | Yes | No |
| Switzerland | 21 | 0.76 | Yes | Yes |
| Syria | 142 | 0.57 | No | No |
| Tajikistan | 95 | 0.68 | Yes | Yes |
| Tanzania | 68 | 0.7 | Yes | Yes |
| Thailand | 75 | 0.69 | No | No |
| Timor-leste | 128 | 0.63 | Yes | No |
| Togo | 0 | 0 | ? | ? |
| Trinidad and Tobago | 128 | 0.63 | Yes | No |
| Tunisia | 117 | 0.65 | No | No |
| Turkey | 131 | 0.63 | No | Yes |
| Turkmenistan | 0 | 0 | ? | ? |
| Uganda | 45 | 0.72 | No | Yes |
| Ukraine | 61 | 0.71 | Yes | No |
| United Arab Emirates | 120 | 0.65 | No | No |
| United Kingdom | 15 | 0.77 | Yes | Yes |
| United States | 49 | 0.72 | Yes | No |
| Uruguay | 56 | 0.71 | Yes | No |
| Uzbekistan | 0 | 0 | ? | ? |
| Venezuela | 60 | 0.71 | Yes | No |
| Viet Nam | 69 | 0.7 | Yes | Yes |
| Western Sahara | 0 | 0 | ? | ? |
| Yemen | 144 | 0.52 | No | No |
| Zambia | 0 | 0 | ? | ? |
| Zimbabwe | 50 | 0.72 | Yes | Yes |
Should Mothers Stay at Home to Raise their Children?
https://www.worldatlas.com/articles/the-misery-index-reveals-the-worst-countries-to-live-in.html
http://www.businessinsider.com/the-worst-places-to-live-in-the-world-2017-8
http://247wallst.com/special-report/2015/12/21/25-worst-countries-to-live-in-the-world/
http://247wallst.com/special-report/2015/12/21/most-livable-countries/2/


