
Shitholes and Shinola
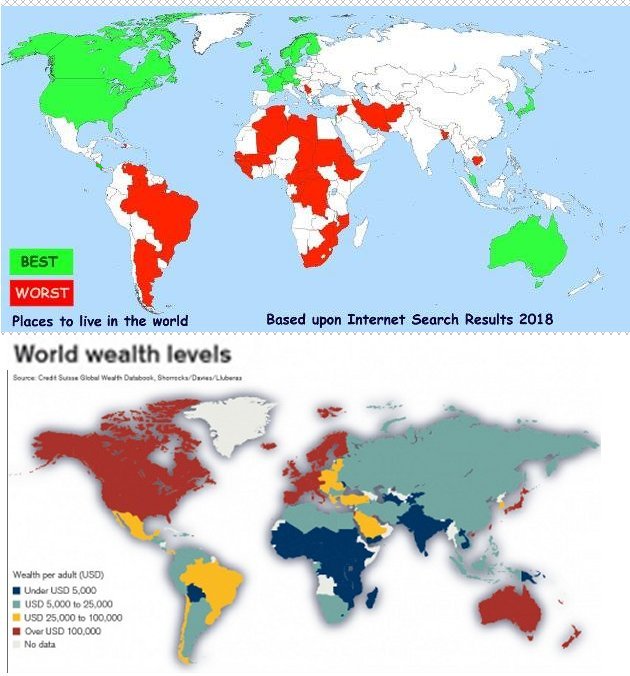
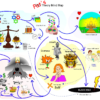
While the shit-storm rages over shit-hole countries, our mind wandered to some queries we made a few years ago as to the racial break-down of “Best Cities in which to Live” best States, best Countries which prompted us to gather some data in a neat little visual to display what is most often referred to as a best country and a worst country. Makes us wonder who writes the lists and for what intended audience.
What are the Best Places to Live vs the Worst in the World?
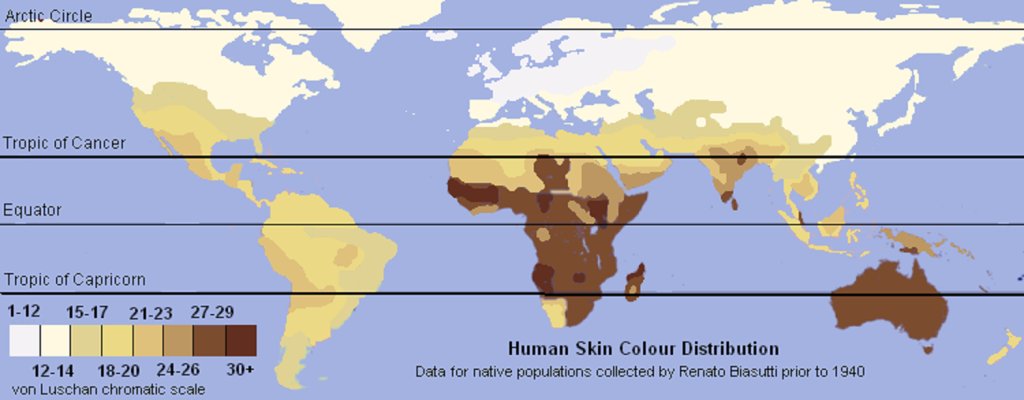
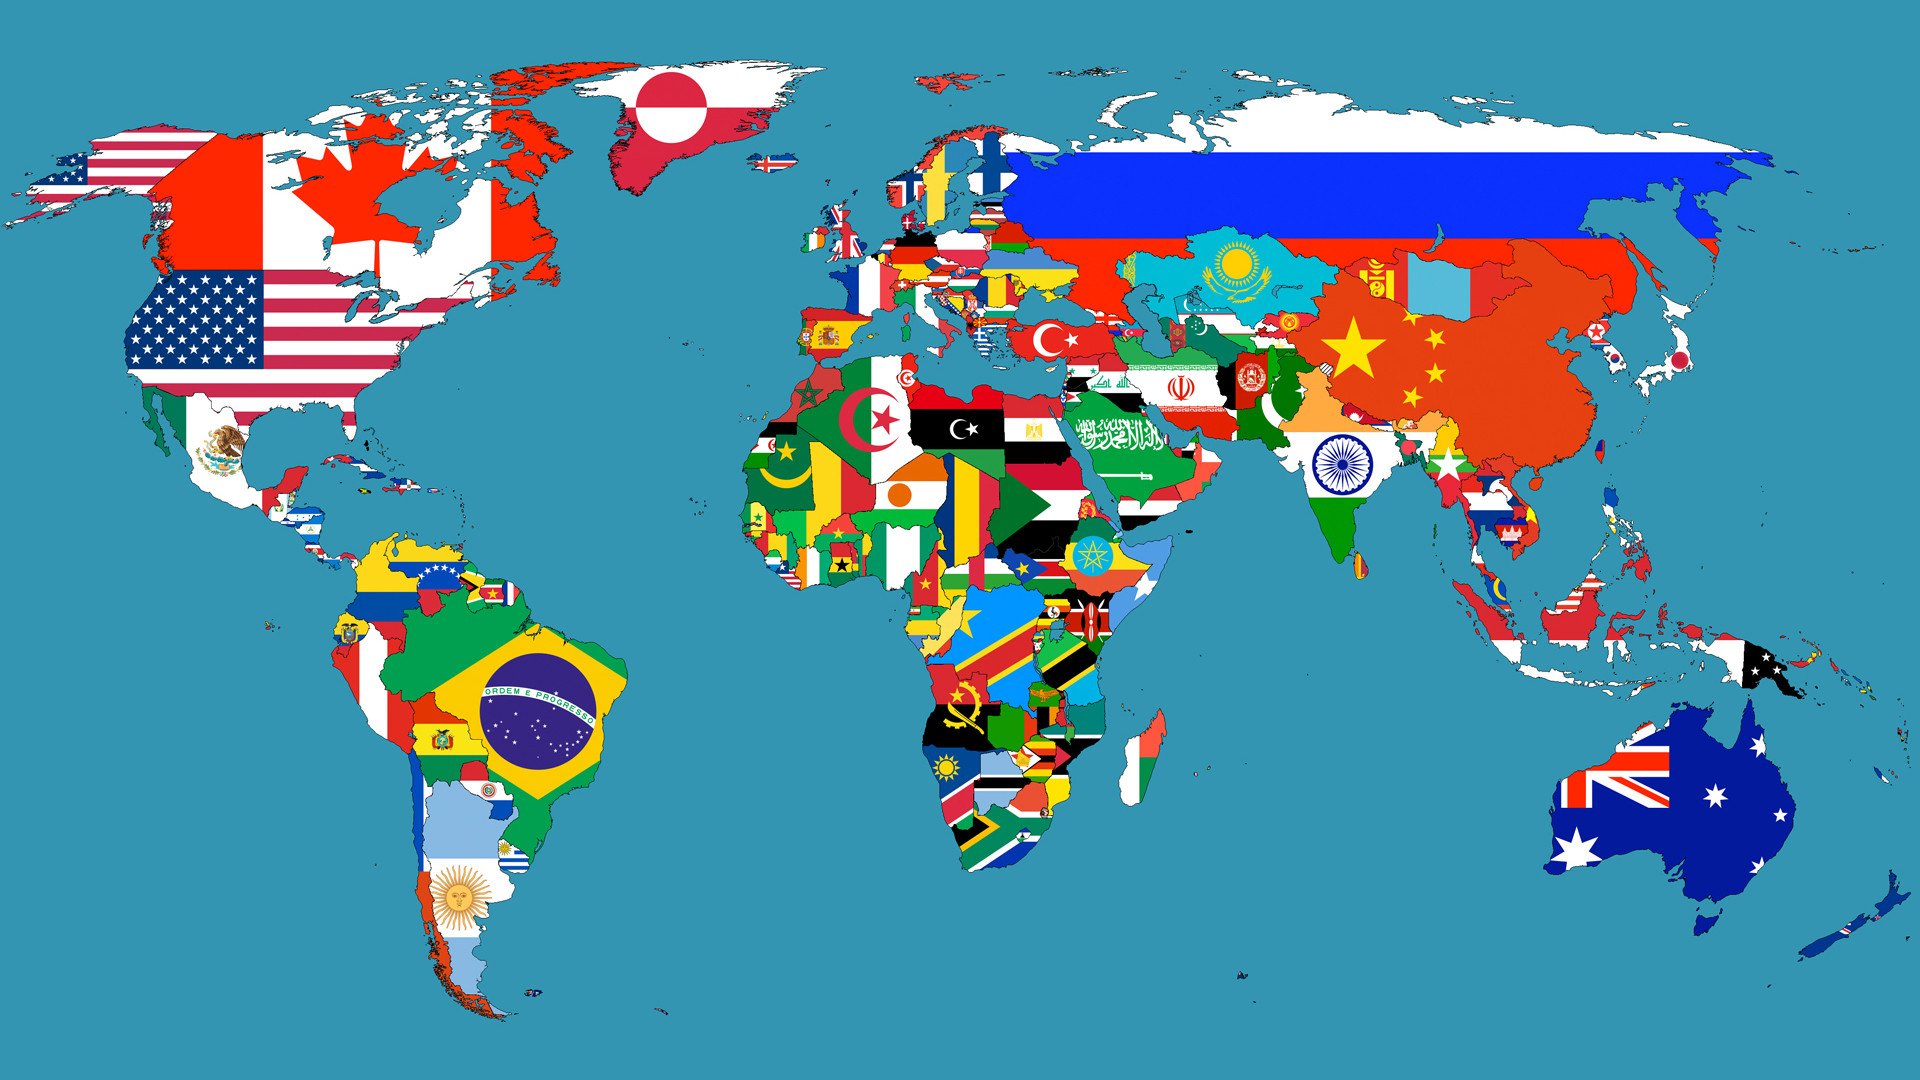
It could be about race, ethnicity and culture…
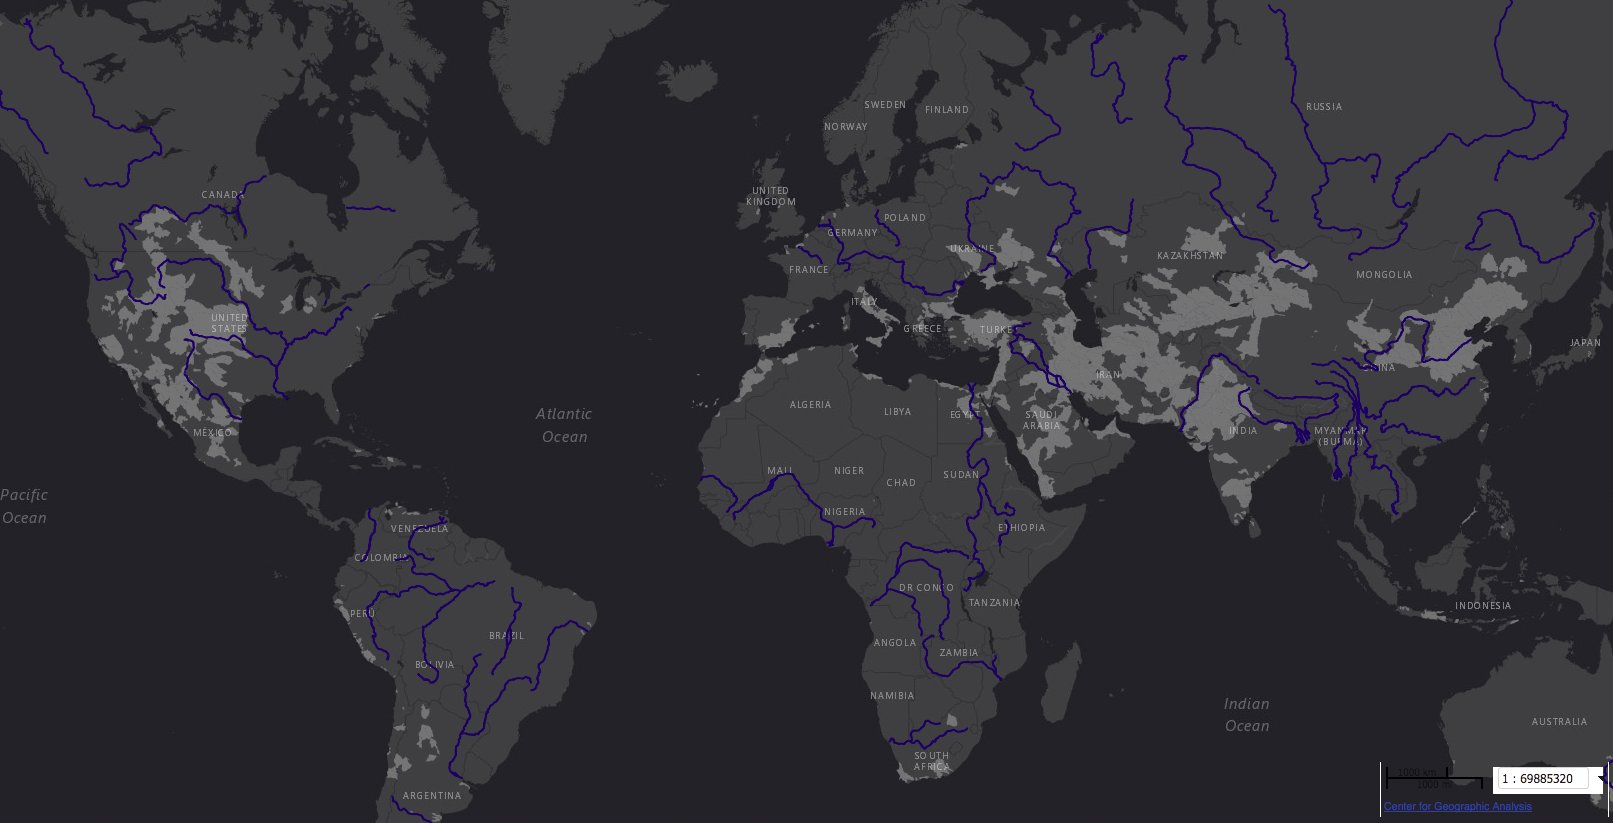
It could be about oil…
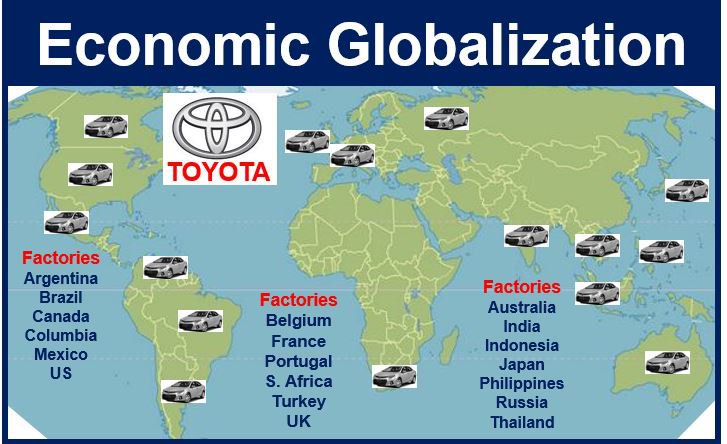
It could be economic globalization (some refer to as colonization)
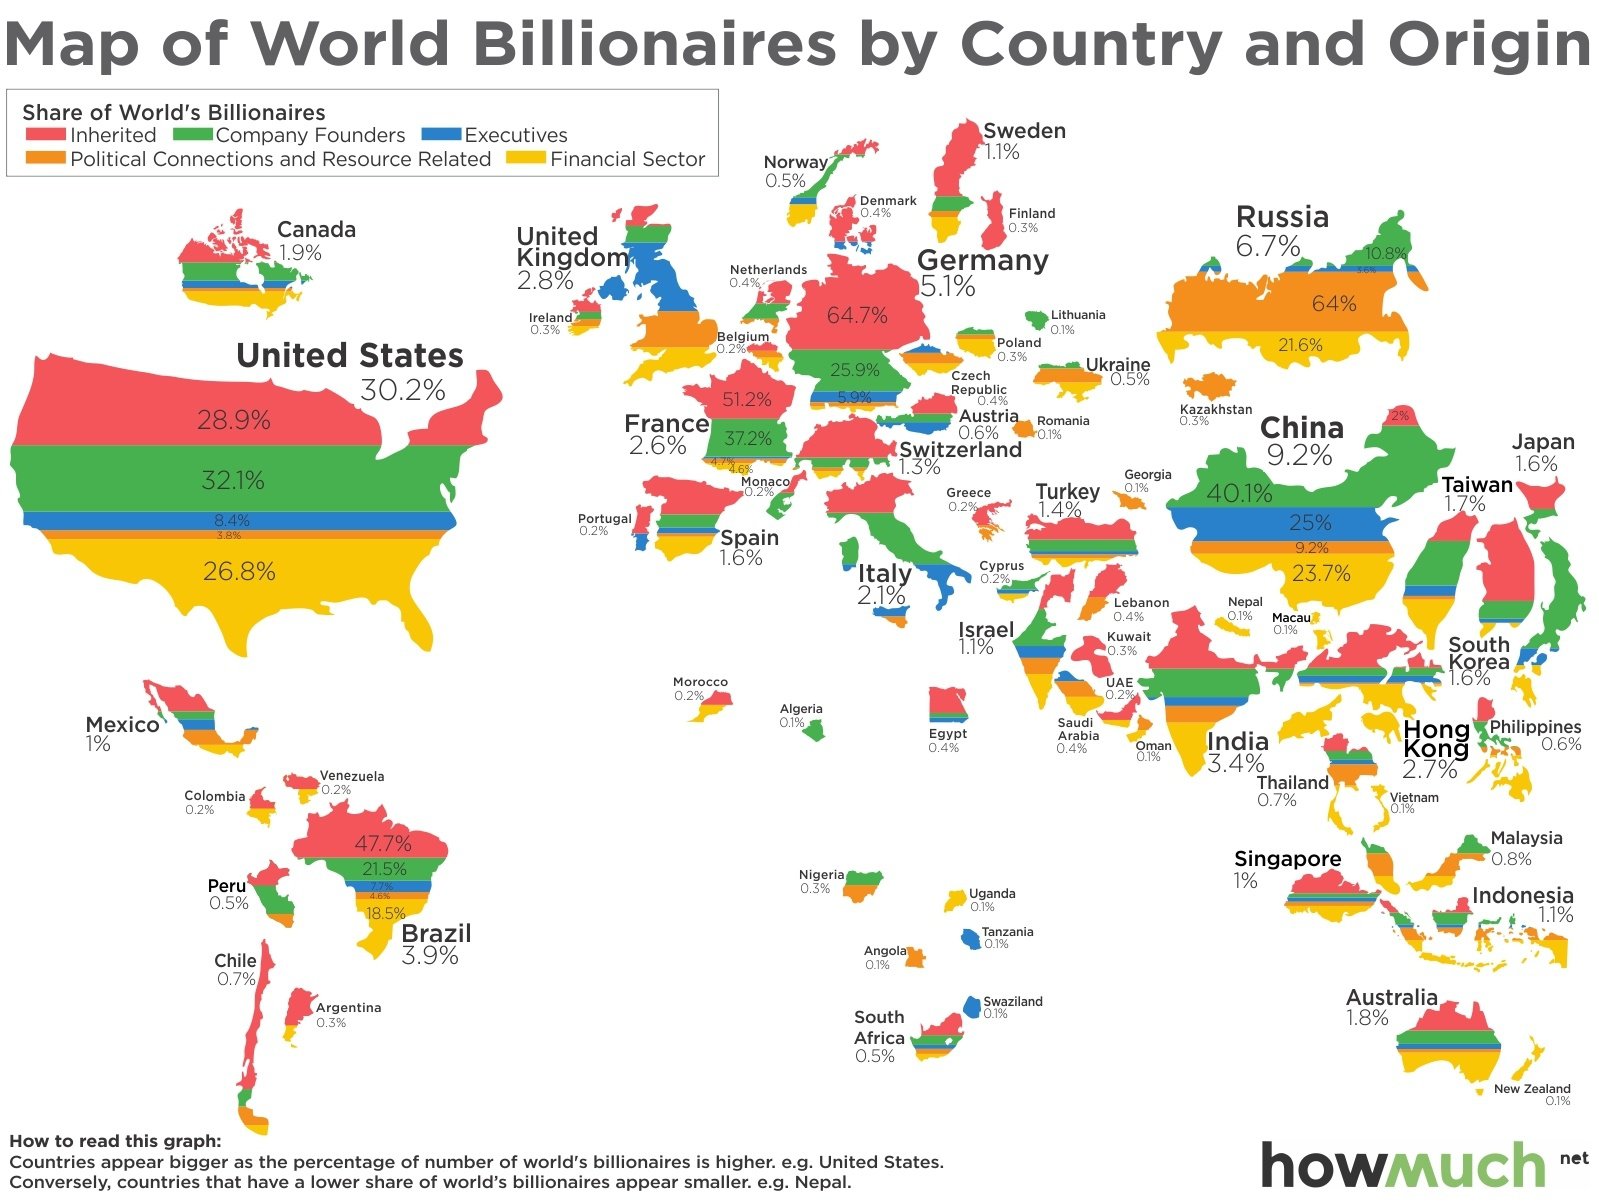
It could be about billionaires who own land with the best places to live
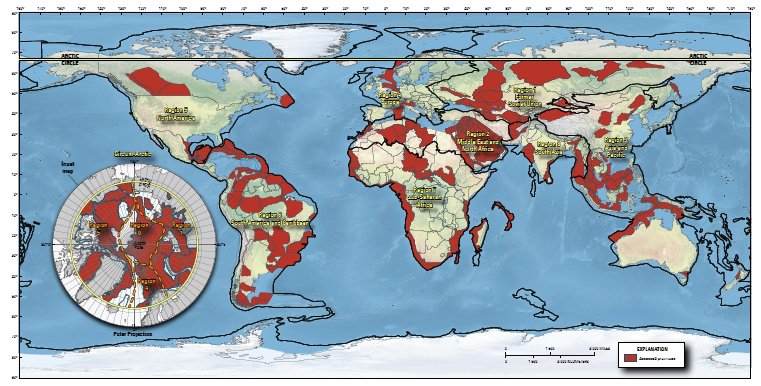
It could be locations of Diamond Mining…


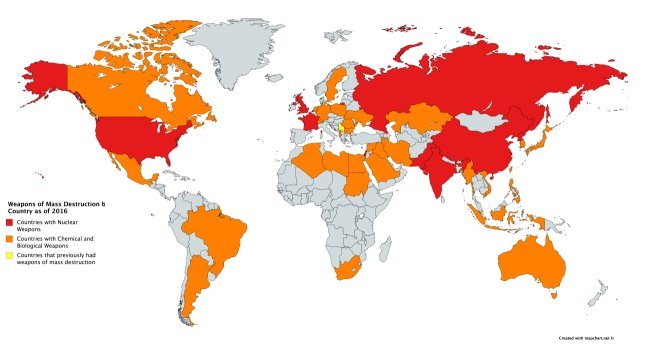
It could be Weapons of Mass Destruction
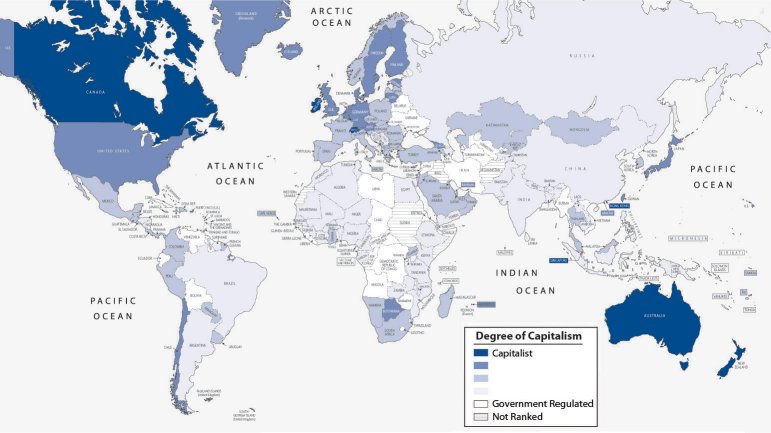
It could be Capitalism vs Communism
https://images.flatworldknowledge.com/barkan/barkan-fig13_001.jpg
communist-countries.jpg” alt=”communist countries” width=”720″ height=”315″ />
https://en.wikipedia.org/wiki/Communist_state#/media/File:Communist_countries.svg
https://commons.wikimedia.org/wiki/File:Map_of_state_atheism.svg
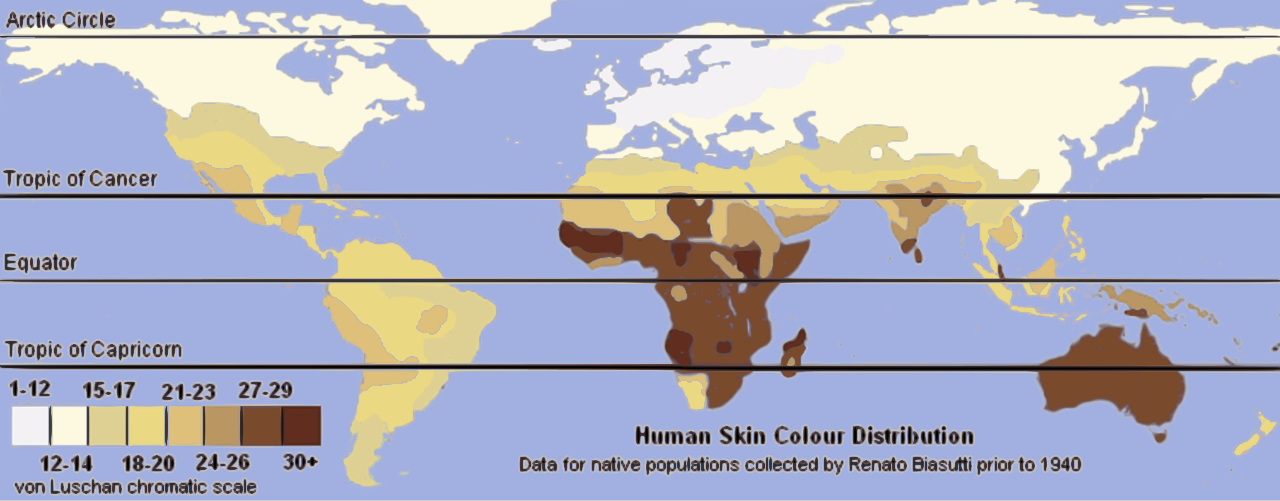
Race is such a narrow a focus….
Or could it be about Freedom https://www.cato.org/human-freedom-index
Rated Best Places to Live |
|
| Australia: Caucasian 92% Asian 7% aboriginal and other 1% Austria: Austrians 91.1% former Yugoslavs 4% (includes Croatians Slovenes Serbs Bosniaks) Turks 1.6% German 0.9% other or unspecified 2.4% (2001) Belgium: Fleming 58% Walloon 31% mixed or other 11% Canada: British Isles origin 28% French origin 23% other European 15% indigenous Indian and Inuit 2% other mostly Asian African Arab 6% mixed background 26% Denmark: Scandinavian Inuit Faroese German Turkish Iranian Somali Finland: Finn 93.4% Swede 5.7% Sami (Lapp) 0.1% Roma 0.2% Estonian 0.2% France: Celtic and Latin with Teutonic Slavic North African Southeast Asian and Basque minorities Germany: German 91.5% Turkish 2.4% Italian 0.7% Greek 0.4% Polish 0.4% other 4.6% Iceland: homogeneous mixture of Norse/Celtic descendants 94% population of foreign origin 6% Ireland: Celtic English Israel: Jewish 80.1% (Europe/Americas/Oceania-born 32.1% Israel-born 20.8% Africa-born 14.6% Asia-born 12.6%) non-Jewish 19.9% (mostly Arab) (1996 est.) Japan: Japanese 99%; Korean Chinese Brazillian Filipino other 1% (2004) Korea, South: homogeneous (except for about 20 000 Chinese) Liechtenstein: Alemannic 86%; Italian Turkish and other 14% Luxembourg: Celtic base (with French and German blend) Portuguese Italian Slavs (from Montenegro Albania and Kosovo) and European (guest and worker residents) Netherlands: Dutch 83% other 17% (9% of non-Western origin mainly Turks Moroccans Antilleans Surinamese and Indonesians) (1999 est.) New Zealand: European 69.8% Maori 7.9% Pacific Islander 4.4% Asian 5.7% other 0.5% mixed 7.8% unspecified 3.8% (2001) Norway: Norwegian Sami 20 0 Singapore: Chinese 76.8% Malay 13.9% Indian 7.9% other 1.4% (2000) Slovenia: Slovene 93.1% Croat 1.8% Serb 2% Bosniak 1.1% other or unspecified 12% (2001) Sweden: indigenous population: Swedes with Finnish and Sami minorities; foreign-born or first-generation immigrants: Finns Yugoslavs Danes Norwegians Greeks Turks Switzerland: German 65% French 18% Italian 10% Romansch 1% other 6% United Kingdom: English 83.6% Scottish 8.6% Welsh 4.9%; Northern Irish 2.9% black 2% Indian 1.8% Pakistani 1.3% mixed 1.2% other 1.6% (2001) United States: White: 211 460 626 (75.1%); Black: 34 658 190 (12.3%); Asian: 10 242 998 (3.6%); American Indian and Alaska Native: 2 475 956 (0.9%); Native Hawaiian and other Pacific Islander: 398 835 (0.1%); other race: 15 359 073 (5.5%); Hispanic origin:1 35 305 818 (12.5%) |
|
Rated Worst Places to Live |
|
| Mali: Mande 50% (Bambara Malinke Sarakole) Peul 17% Voltaic 12% Tuareg and Moor 10% Songhai 6% other 5% Liberia: indigenous African tribes 95% (including Kpelle Bassa Gio Kru Grebo Mano Krahn Gola Gbandi Loma Kissi Vai Bella Mandingo and Mende) Americo-Liberians 2.5% (descendants of former U.S. slaves) Congo People 2.5% (descendants of former Caribbean slaves) Libya: Berber and Arab 97% Greeks Maltese Italians Egyptians Pakistanis Turks Indians Tunisians Mozambique: indigenous tribal groups 99.66% (Shangaan Chokwe Manyika Sena Makua and others) Europeans 0.06% Euro-Africans 0.2% Indians 0.08% Sudan: black 52% Arab 39% Beja 6% foreigners 2% other 1% South Africa: black African 79% white 9.6% colored 8.9% Indian/Asian 2.5% (2001) Syria: Arab 90.3% Kurds Armenians and other 9.7% Venezuela: Spanish Italian Portuguese Arab German African indigenous people Zimbabwe: African 98% (Shona 82% Ndebele 14% other 2%) mixed and Asian 1% white less than 1% São Tomé and Príncipe: mestico (mixed European and native African) angolares (descendants of Angolan slaves) forros (descendants of freed slaves) servicais (contract laborers from Angola Mozambique and Cape Verde) tongas (children of servicais born on the islands) Europeans (primarily Portuguese) Senegal: Wolof 43.3% Fulani 23.8% Serer 14.7% Diola 3.7% Mandingo 3% Soninke 1.1% European and Lebanese 1% other 9.4% Serbia: Serb 66% Albanian 17% Hungarian 3.5% other 13.5% (1991) Sierra Leone: 20 native African tribes 90% (Temne 30% Mende 30% other 30%); Creole (Krio) 10%; refugees from Liberia’s recent civil war small numbers of Europeans Lebanese Pakistanis and Indians Afghanistan: Pashtun 42% Tajik 27% Hazara 9% Uzbek 9% Aimaks 4% Turkmen 3% Baloch 2% others 4% Iran: Persian 51% Azerbaijani 24% Gilaki and Mazandarani 8% Kurd 7% Arab 3% Lur 2% Baloch 2% Turkmen 2% other 1% Guinea: Peuhl 40% Malinke 30% Susu 20% smaller tribes 10% Guinea-Bissau: African 99% (Balanta 30% Fula 20% Manjaca 14% Mandinga 13% Papel 7%) European and mulatto less than 1% Haiti: black 95% mulatto and white 5% Eritrea: ethnic Tigrinya 50% Tigre and Kunama 40% Afar 4% Saho (Red Sea coast dwellers) 3% other 3% Algeria: Arab-Berber 99% European less than 1% Ethiopia: Oromo 40% Amhara and Tigrean 32% Sidamo 9% Shankella 6% Somali 6% Afar 4% Gurage 2% other 1% Djibouti: Somali 60% Afar 35% French Arab Ethiopian and Italian 5% Congo, Democratic Republic of the: With over 200 African ethnic groups the majority are Bantu; the four largest tribes—Mongo Luba Kongo (all Bantu) and the Mangbetu-Azande (Hamitic)—make up about 45% of the population Congo, Republic of: Kongo 48% Sangha 20% M’Bochi 12% Teke 17% Europeans and other 3% Côte d’Ivoire: Akan 42.1% Voltaiques (Gur) 17.6% Northern Mandes 16.5% Krous 11% Southern Mandes 10% other 2.8% (includes 130 000 Lebanese and 14 000 French) (1998) Central African Republic: Baya 33% Banda 27% Mandjia 13% Sara 10% Mboum 7% M’Baka 4% Yakoma 4% other 2% Chad: 200 distinct groups. North and center mostly Muslim: Arabs Gorane (Toubou Daza Kreda) Zaghawa Kanembou Ouaddai Baguirmi Hadjerai Fulbe Kotoko Hausa Boulala and Maba. South mostly Christian or animist: Sara (Ngambaye Mbaye Goulaye) Moundang Burkina Faso: Mossi (over 40%) Gurunsi Senufo Lobi Bobo Mande Fulani Burundi: Hutu (Bantu) 85% Tutsi (Hamitic) 14% Twa (Pygmy) 1% Cambodia: Khmer 90% Vietnamese 5% Chinese 1% other 4% Cameroon: Cameroon Highlanders 31% Equatorial Bantu 19% Kirdi 11% Fulani 10% Northwest Bantu 8% Eastern Nigritic 7% other African 13% non-African less than 1% Brazil: white 53.7% mulatto (mixed white and black) 38.5% black 6.2% other (includes Japanese Arab Amerindian) 0.9% unspecified 0.7% (2000) Argentina: white (mostly Spanish and Italian) 97%; mestizo Amerindian other 3% Bangladesh: Bengali 98% tribal groups non-Bengali Muslims (1998) |
|
Resources, maps and charts borrowed from:
https://www.worldatlas.com/articles/the-misery-index-reveals-the-worst-countries-to-live-in.html
http://www.businessinsider.com/the-worst-places-to-live-in-the-world-2017-8
http://247wallst.com/special-report/2015/12/21/25-worst-countries-to-live-in-the-world/
http://247wallst.com/special-report/2015/12/21/most-livable-countries/2/
http://www.zarkanderson.com/2012/04/usgs-estimates-worlds-remaining-oil-and-gas-reserves.html
https://en.wikipedia.org/wiki/List_of_contemporary_ethnic_groups
https://en.wikipedia.org/wiki/Color_terminology_for_race
https://upload.wikimedia.org/wikipedia/commons/thumb/6/6a/Unlabeled_Renatto_Luschan_Skin_color_map.svg/1280px-Unlabeled_Renatto_Luschan_Skin_color_map.svg.png
https://www.canadiangeographic.ca/article/stunning-interactive-map-shows-globalization-youve-never-seen
https://en.wikipedia.org/wiki/World_Game
http://marketbusinessnews.com/financial-glossary/economic-globalization/
https://www.goodnet.org/articles/9-maps-to-change-how-you-see-world
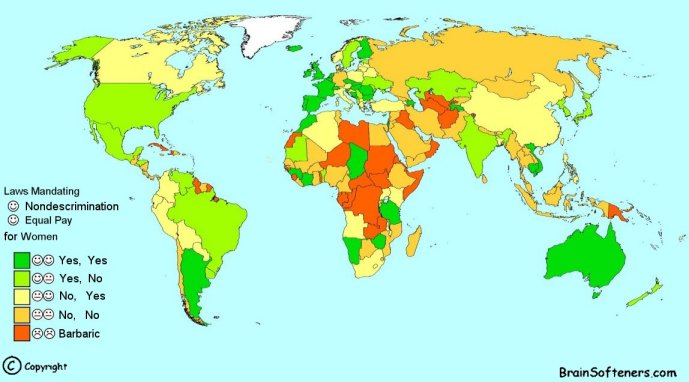
http://www.telegraph.co.uk/travel/maps-and-graphics/mapped-the-best-and-worst-countries-for-gender-equality/
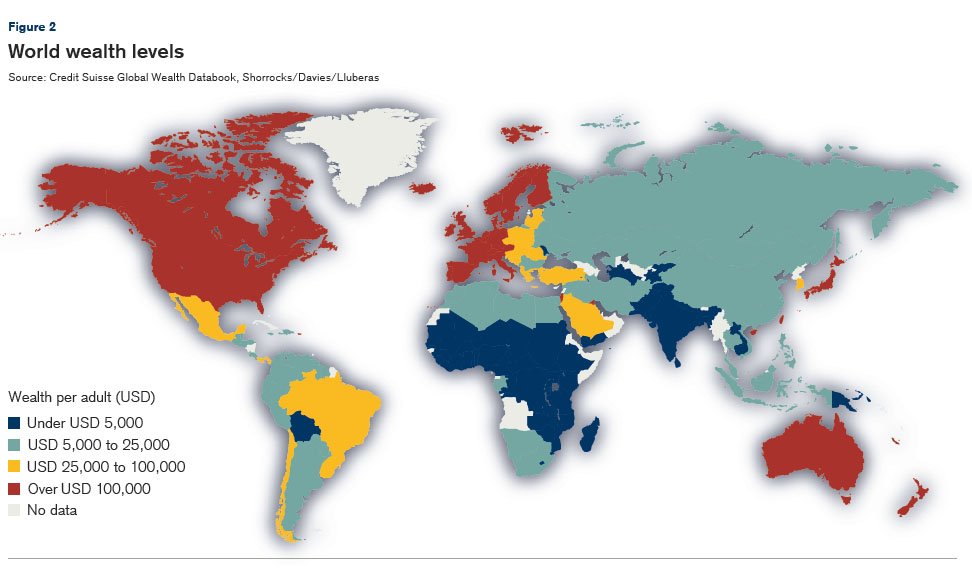
https://www.zerohedge.com/article/detailed-look-global-wealth-distribution
https://en.wikipedia.org/wiki/Human_overpopulation
https://commons.wikimedia.org/wiki/File:Weapons_of_Mass_Destruction_by_Country_as_of_2016.png
https://en.wikipedia.org/wiki/List_of_countries_by_percentage_of_population_living_in_poverty
https://geology.com/articles/gem-diamond-map/
https://en.wikipedia.org/wiki/List_of_countries_by_coffee_production
and a whole bunch more links exist out there as well as definitions and map locations that we didn’t save – look it up yourselves, it’s easy.